Categories
日常应用

七天搞定SAS(三):基本模块调用(格式、计数、概要统计、排序等)

本系列连载文章:

搞定基本的函数之后,开始鼓捣SAS里面的模型。也就是说,要开始写PROC了。说实话,越学SAS,越觉得SAS像Stata...无论是从输出的样式,还是语法。好不习惯没有()的模型调用呀。若是说SAS和Stata的区别,怕只是Stata更侧重于计量模型而SAS则是服务于大多数统计模型吧。

PROC的基本内容:CONTENT

先是一个最基本的PROC:content,可以显示数据集的主要特性。比如,

LIBNAME tropical 'c:\MySASLib';
PROC CONTENTS DATA = tropical.banana;

这里主要是两个声明:TITLE和FOOTNOTE。前者输出时候会产生一个标题,后者会产生尾注。用法也是比较直接的:

TITLE ”Here’s another title”;
TITLE ’Here’’s another title’;
FOOTNOTE3 ’This is the third footnote’;

最后还有一个很像Stata的LABEL声明:

LABEL ReceiveDate = ’Date order was received’
ShipDate = ’Date merchandise was shipped’;

可以变量加注释。其实R里面给变量加注释是一件非常麻烦的事情,只有少数几个包可以搞定,还非常不值的。一般说来,我尽量在变量命名的时候长一点,这样直接可以读懂;再就是重建一个新的表,存储变量名和label。

SAS PROC求子集:WHERE

如果要在PROC里面先求子集的话,可以直接调用WHERE。感觉这里和SQL的思路比较像。用法也算是比较简单(SAS里面的用法都不是很麻烦,除了某些模型):

PROC PRINT DATA = 'c:\MySASLib\style';
WHERE Genre = 'Impressionism';
TITLE 'Major Impressionist Painters';
FOOTNOTE 'F = France N = Netherlands U = US';
RUN;

这样最终得到的结果就是:

Major Impressionist Painters 1
Obs Name Genre Origin
1 Mary Cassatt Impressionism U
3 Edgar Degas Impressionism F
5 Claude Monet Impressionism F
6 Pierre Auguste Renoir Impressionism F
F = France N = Netherlands U = US

SAS PROC 数据进行排序:SORT

排序就更简单了,直接PROC SORT就可以了。

DATA marine;
INFILE 'c:\MyRawData\Lengths.dat';
INPUT Name $ Family $ Length @@;
RUN;
* Sort the data;
PROC SORT DATA = marine OUT = seasort NODUPKEY;
BY Family DESCENDING Length;
PROC PRINT DATA = seasort;
TITLE 'Whales and Sharks';
RUN;

这样数据就按照Family、Length(递减)排序了。

Whales and Sharks 1
Obs Name Family Length
1 humpback 50.0
2 whale shark 40.0
3 basking shark 30.0
4 mako shark 12.0
5 dwarf shark 0.5
6 blue whale 100.0
7 sperm whale 60.0
8 gray whale 50.0
9 killer whale 30.0
10 beluga whale 15.0

SAS PROC 输出数据:PRINT

最简单的数据输出怕就是PRINT了,顾名思义,直接打印数据出来。这里可以进行便啦的选择,还就可以选择统计量:

DATA sales;
INFILE 'c:\MyRawData\Candy.dat';
INPUT Name $ 1-11 Class @15 DateReturned MMDDYY10. CandyType $
Quantity;
Profit = Quantity * 1.25;
PROC SORT DATA = sales;
BY Class;
PROC PRINT DATA = sales;
BY Class;
SUM Profit;
VAR Name DateReturned CandyType Profit;
TITLE 'Candy Sales for Field Trip by Class';
RUN;

得到的结果为:

Candy Sales for Field Trip by Class 1
-------------------------------- Class=14 ---------------------------------
Date Candy
Obs Name Returned Type Profit
1 Nathan 17612 CD 23.75
2 Matthew 17612 CD 17.50
3 Claire 17613 CD 13.75
4 Chris 17616 CD 7.50
5 Stephen 17616 CD 12.50
----- ------
Class 75.00
-------------------------------- Class=21 ---------------------------------
Date Candy
Obs Name Returned Type Profit
6 Adriana 17612 MP 8.75
7 Caitlin 17615 CD 11.25
8 Ian 17615 MP 22.50
9 Anthony 17616 MP 16.25
10 Erika 17616 MP 21.25
----- ------
Class 80.00
======
155.00

SAS PROC里面改变输出格式:FORMAT

基本就是FORMAT一下就可以了,再就是PUT的时候也可以调整。

DATA sales;
INFILE 'c:\MyRawData\Candy.dat';
INPUT Name $ 1-11 Class @15 DateReturned MMDDYY10. CandyType $
Quantity;
Profit = Quantity * 1.25;
PROC PRINT DATA = sales;
VAR Name DateReturned CandyType Profit;
FORMAT DateReturned DATE9. Profit DOLLAR6.2;
TITLE 'Candy Sale Data Using Formats';
RUN;

输出结果为:

Candy Sale Data Using Formats 1
Date Candy
Obs Name Returned Type Profit
1 Adriana 21MAR2008 MP $8.75
2 Nathan 21MAR2008 CD $23.75
3 Matthew 21MAR2008 CD $17.50
4 Claire 22MAR2008 CD $13.75
5 Caitlin 24MAR2008 CD $11.25
6 Ian 24MAR2008 MP $22.50
7 Chris 25MAR2008 CD $7.50
8 Anthony 25MAR2008 MP $16.25
9 Stephen 25MAR2008 CD $12.50
10 Erika 25MAR2008 MP $21.25

常用的格式有:

  • 文本型:$HEXw.和$w.
  • 日期型:DATEw.(输出为ddmmyy或者ddmmyyyy)、DATETIMEw.d(输出为ddmmyy:hh:mm:ss)、DAYw.(输出为dd)、EURDFDDw. 、JULIANw.、MMDDYYw.(输出为mmddyy或mmddyyyy)、TIMEw.d(输出为hh:mm:ss)、WEEKDATEw.(输出为工作日)、WORDDATEw.(输出为单词)。
  • 数字型:BESTw.(自动选择)、COMMAw.d(逗号分隔)、DOLLARw.d(货币)、Ew.(科学计数法)、PDw.d、w.d(标准小数)

输出的样本见下:

当然FORMAT还可以自定义factor型变量的输出格式,比如:

DATA carsurvey;
INFILE 'c:\MyRawData\Cars.dat';
INPUT Age Sex Income Color $;
PROC FORMAT;
VALUE gender 1 = 'Male'
2 = 'Female';
VALUE agegroup 13 -< 20 = 'Teen'
20 -< 65 = 'Adult'
65 - HIGH = 'Senior';
VALUE $col 'W' = 'Moon White'
'B' = 'Sky Blue'
'Y' = 'Sunburst Yellow'
'G' = 'Rain Cloud Gray';
* Print data using user-defined and standard (DOLLAR8.) formats;
PROC PRINT DATA = carsurvey;
FORMAT Sex gender. Age agegroup. Color $col. Income DOLLAR8.;
TITLE 'Survey Results Printed with User-Defined Formats';
RUN;

就可以把数字型的1,2转换为对应的文本male和female等,还可以把变量离散化,得到的输出为:

Survey Results Printed with User-Defined Formats 1
Obs Age Sex Income Color
1 Teen Male $14,000 Sunburst Yellow
2 Adult Male $65,000 Rain Cloud Gray
3 Senior Female $35,000 Sky Blue
4 Adult Male $44,000 Sunburst Yellow
5 Adult Female $83,000 Moon White

最终可以实现的自定义输出还包括简单的文本连接,比如:

* Write a report with FILE and PUT statements;
DATA _NULL_;
INFILE 'c:\MyRawData\Candy.dat';
INPUT Name $ 1-11 Class @15 DateReturned MMDDYY10.
CandyType $ Quantity;
Profit = Quantity * 1.25;
FILE 'c:\MyRawData\Student.txt' PRINT;
TITLE;
PUT @5 'Candy sales report for ' Name 'from classroom ' Class
// @5 'Congratulations! You sold ' Quantity 'boxes of candy'
/ @5 'and earned ' Profit DOLLAR6.2 ' for our field trip.';
PUT _PAGE_;
RUN;

可以给出若干连续的输出(注意DATA _NULL_;将不生成任何SAS的数据表):

Candy sales report for Adriana from classroom 21
Congratulations! You sold 7 boxes of candy and earned $8.75 for our field trip.
------------
Candy sales report for Nathan from classroom 14
Congratulations! You sold 19 boxes of candy and earned $23.75 for our field trip.
------------
Candy sales report for Matthew from classroom 14
Congratulations! You sold 14 boxes of candy and earned $17.50 for our field trip.
------------

SAS里面总结数据:MEANS

SAS当然还有类似于excel的数据透视表和R的data.table的模块,就是MEANS。可以输出的summary statistics包括最大值、最小值、平均值、中位数、余非缺失值个数、缺失值个数、范围、标准差、和等等。此外,还可以使用BY或者CLASS进行分组统计,VAR选择变量等。

比如:

DATA sales;
INFILE 'c:\MyRawData\Flowers.dat';
INPUT CustomerID $ @9 SaleDate MMDDYY10. Petunia SnapDragon
Marigold;
Month = MONTH(SaleDate);
PROC SORT DATA = sales;
BY Month;
* Calculate means by Month for flower sales;
PROC MEANS DATA = sales;
BY Month;
VAR Petunia SnapDragon Marigold;
TITLE 'Summary of Flower Sales by Month';
RUN;

可以实现:

Summary of Flower Sales by Month 1
--------------------------------- Month=5 ---------------------------------
The MEANS Procedure
Variable N Mean Std Dev Minimum Maximum
---------------------------------------------------------------------------
Petunia 3 86.6666667 35.1188458 50.0000000 120.0000000
SnapDragon 3 113.3333333 41.6333200 80.0000000 160.0000000
Marigold 3 81.6666667 25.6580072 60.0000000 110.0000000
--------------------------------- Month=6 ---------------------------------
Variable N Mean Std Dev Minimum Maximum
---------------------------------------------------------------------------
Petunia 4 81.2500000 16.5201897 60.0000000 100.0000000
SnapDragon 4 97.5000000 47.8713554 60.0000000 160.0000000
Marigold 4 83.7500000 19.7378655 60.0000000 100.0000000
---------------------------------------------------------------------------

当然这些统计量也可以直接的写入一个SAS数据表,只需要加上一个OUTPUT就可以了。原数据:

756-01 05/04/2008 120 80 110
834-01 05/12/2008 90 160 60
901-02 05/18/2008 50 100 75
834-01 06/01/2008 80 60 100
756-01 06/11/2008 100 160 75
901-02 06/19/2008 60 60 60
756-01 06/25/2008 85 110 100

SAS代码:

DATA sales;
INFILE 'c:\MyRawData\Flowers.dat';
INPUT CustomerID $ @9 SaleDate MMDDYY10. Petunia SnapDragon Marigold;
PROC SORT DATA = sales;
BY CustomerID;
* Calculate means by CustomerID, output sum and mean to new data set;
PROC MEANS NOPRINT DATA = sales;
BY CustomerID;
VAR Petunia SnapDragon Marigold;
OUTPUT OUT = totals MEAN(Petunia SnapDragon Marigold) =
MeanPetunia MeanSnapDragon MeanMarigold
SUM(Petunia SnapDragon Marigold) = Petunia SnapDragon Marigold;
PROC PRINT DATA = totals;
TITLE 'Sum of Flower Data over Customer ID';
FORMAT MeanPetunia MeanSnapDragon MeanMarigold 3.;
RUN;

最终结果为:

2013-12-09 16_28_08-The Little SAS Book(Fourth).PDF - Adobe Reader

SAS PROC统计频率:FREQ

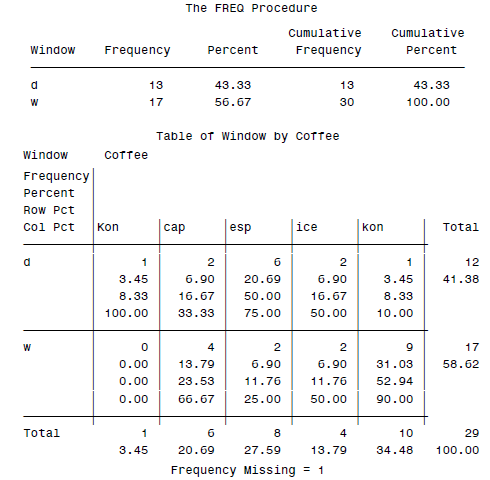
计数的话,就要靠SAS里面的FREQ模块了。比如我们有一个数据集:

esp w cap d cap w kon w ice w kon d esp d kon w ice d esp d
cap w esp d cap d Kon d . d kon w esp d cap w ice w kon w
kon w kon w ice d esp d kon w esp d esp w kon w cap w kon w

然后可以用FREQ来统计一些基本量:

DATA orders;
INFILE 'c:\MyRawData\Coffee.dat';
INPUT Coffee $ Window $ @@;
* Print tables for Window and Window by Coffee;
PROC FREQ DATA = orders;
TABLES Window Window * Coffee;
RUN;

最终会得到一个2×5的表格:

2013-12-09 16_29_11-The Little SAS Book(Fourth).PDF - Adobe Reader

SAS PROC汇报表格:TABULATE

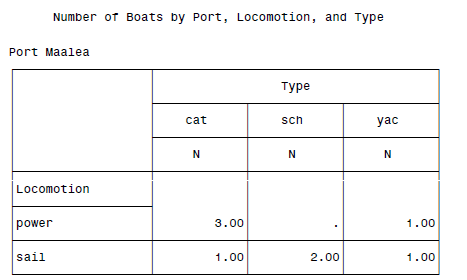
基本看到TABULATE就可以想到那个著名的软件Tabular了...不过貌似SAS也自带了一个类似的表格模块。这个东西可以变得非常复杂,不过鉴于我一时半会儿还用不到,所以也没有细细看。抄个例子吧。

原数据:

Silent Lady Maalea sail sch 75.00
America II Maalea sail yac 32.95
Aloha Anai Lahaina sail cat 62.00
Ocean Spirit Maalea power cat 22.00
Anuenue Maalea sail sch 47.50
Hana Lei Maalea power cat 28.99
Leilani Maalea power yac 19.99
Kalakaua Maalea power cat 29.50
Reef Runner Lahaina power yac 29.95
Blue Dolphin Maalea sail cat 42.95

SAS代码:

DATA boats;
INFILE 'c:\MyRawData\Boats.dat';
INPUT Name $ 1-12 Port $ 14-20 Locomotion $ 22-26 Type $ 28-30
Price 32-36;
RUN;
* Tabulations with three dimensions;
PROC TABULATE DATA = boats;
CLASS Port Locomotion Type;
TABLE Port, Locomotion, Type;
TITLE 'Number of Boats by Port, Locomotion, and Type';
RUN;

最终结果:
2013-12-09 16_30_08-The Little SAS Book(Fourth).PDF - Adobe Reader

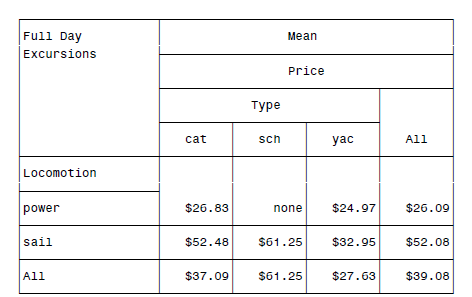
类似的,还可以增加统计量(类似于MEANS那里):

DATA boats;
INFILE 'c:\MyRawData\Boats.dat';
INPUT Name $ 1-12 Port $ 14-20 Locomotion $ 22-26 Type $ 28-30
Price 32-36;
RUN;
* PROC TABULATE report with options;
PROC TABULATE DATA = boats FORMAT=DOLLAR9.2;
CLASS Locomotion Type;
VAR Price;
TABLE Locomotion ALL, MEAN*Price*(Type ALL)
/BOX='Full Day Excursions' MISSTEXT='none';
TITLE;
RUN;

可以得到:
2013-12-09 16_32_12-The Little SAS Book(Fourth).PDF - Adobe Reader

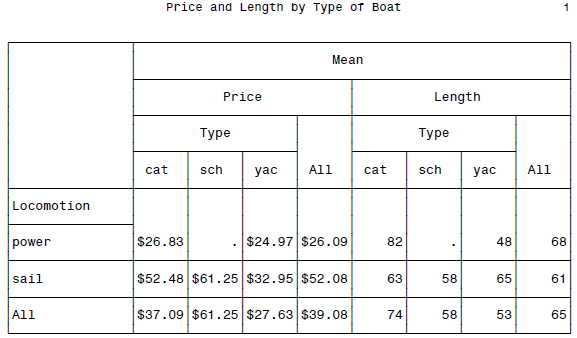
最后还可以混合FORMAT等等,可以变得相当的复杂。貌似这东西是美国劳工部鼓捣出来的格式...

DATA boats;
INFILE 'c:\MyRawData\Boats.dat';
INPUT Name $ 1-12 Port $ 14-20 Locomotion $ 22-26 Type $ 28-30
Price 32-36 Length 38-40;
RUN;
* Using the FORMAT= option in the TABLE statement;
PROC TABULATE DATA = boats;
CLASS Locomotion Type;
VAR Price Length;
TABLE Locomotion ALL,
MEAN * (Price*FORMAT=DOLLAR6.2 Length*FORMAT=6.0) * (Type ALL);
TITLE 'Price and Length by Type of Boat';
RUN;

BOSS级汇报表格呈现了...

2013-12-09 16_32_50-The Little SAS Book(Fourth).PDF - Adobe Reader

我只能感慨,不愧是商业软件啊,用户需求考虑的真的是特别的周到...这种费时费力做汇报表格的事情也被搞定了,强悍。

SAS里面的报告:REPORT

还有一个REPORT,看到有TABULATE的时候我已经不奇怪并略略的有些期待一个做报告的模块出现了。这东西基本就是前面几个的超级混合体,反正你想搞到的汇报模式总是能够搞出来的。

又是一堆数据:

17 sci 9 bio 28 fic 50 mys 13 fic 32 fic 67 fic 81 non 38 non
53 non 16 sci 15 bio 61 fic 52 ref 22 mys 76 bio 37 fic 86 fic
49 mys 78 non 45 sci 64 bio 8 fic 11 non 41 fic 46 ref 69 fic
34 fic 26 mys 23 sci 74 ref 15 sci 27 fic 23 mys 63 fic 78 non
40 bio 12 fic 29 fic 54 mys 67 fic 60 fic 38 sci 42 fic 80 fic

然后一堆SAS代码:

DATA books;
INFILE 'c:\MyRawData\LibraryBooks.dat';
INPUT Age BookType $ @@;
RUN;
*Define formats to group the data;
PROC FORMAT;
VALUE agegpa
0-18 = '0 to 18'
19-25 = '19 to 25'
26-49 = '26 to 49'
50-HIGH = ' 50+ ';
VALUE agegpb
0-25 = '0 to 25'
26-HIGH = ' 26+ ';
VALUE $typ
'bio','non','ref' = 'Non-Fiction'
'fic','mys','sci' = 'Fiction';
RUN;
*Create two way table with Age grouped into four categories;
PROC FREQ DATA = books;
TITLE 'Patron Age by Book Type: Four Age Groups';
TABLES BookType * Age / NOPERCENT NOROW NOCOL;
FORMAT Age agegpa. BookType $typ.;
RUN;
*Create two way table with Age grouped into two categories;
PROC FREQ DATA = books;
TITLE 'Patron Age by Book Type: Two Age Groups';
TABLES BookType * Age / NOPERCENT NOROW NOCOL;
FORMAT Age agegpb. BookType $typ.;
RUN;

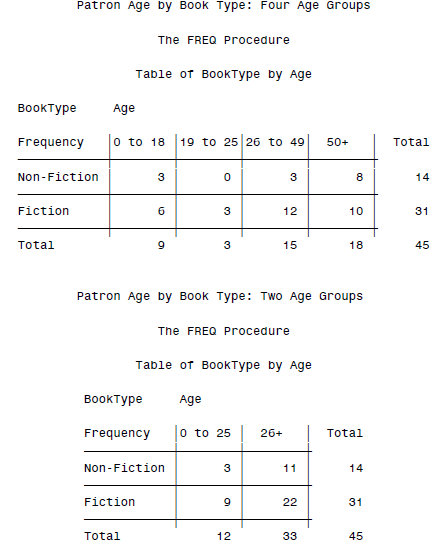
然后一堆交叉计数的结果就出来了:
2013-12-09 16_33_53-The Little SAS Book(Fourth).PDF - Adobe Reader

当然,简单的计算和分类统计也不在话下:

DATA natparks;
INFILE 'c:\MyRawData\Parks.dat';
INPUT Name $ 1-21 Type $ Region $ Museums Camping;
RUN;
*Statistics in COLUMN statement with two group variables;
PROC REPORT DATA = natparks NOWINDOWS HEADLINE;
COLUMN Region Type N (Museums Camping),MEAN;
DEFINE Region / GROUP;
DEFINE Type / GROUP;
TITLE 'Statistics with Two Group Variables';
RUN;
*Statistics in COLUMN statement with group and across variables;
PROC REPORT DATA = natparks NOWINDOWS HEADLINE;
COLUMN Region N Type,(Museums Camping),MEAN;
DEFINE Region / GROUP;
DEFINE Type / ACROSS;
TITLE 'Statistics with a Group and Across Variable';
RUN;

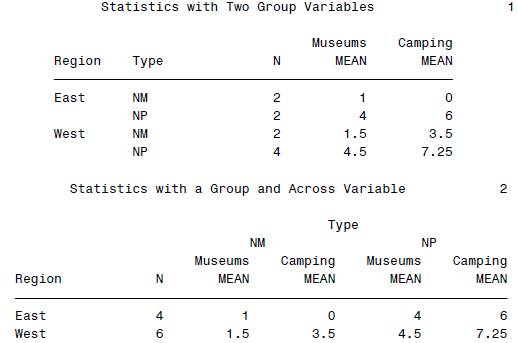
可以得到一个看起来很fancy的表格:
2013-12-09 16_34_41-The Little SAS Book(Fourth).PDF - Adobe Reader

SAS数据总结综述

我的感觉是,MEANS, TABULATE和REPORT这三个模块各有千秋,基本就是可以替代EXCEL的数据透视表,虽然效率上说不好谁比谁高...随便哪一个用习惯了就好,反正又不是天天出政府报告的,我就懒得深究了。


Categories
日常应用

七天搞定SAS(二):基本操作(判断、运算、基本函数)

本系列连载文章:

继续,今天开始注重变量操作。

SAS生成新变量

SAS支持基本的加减乘除,值得一提的是它的**代表指数,而不是^。

* Modify homegarden data set with assignment statements;
DATA homegarden;
INFILE 'c:\MyRawData\Garden.dat';
INPUT Name $ 1-7 Tomato Zucchini Peas Grapes;
Zone = 14;
Type = 'home';
Zucchini = Zucchini * 10;
Total = Tomato + Zucchini + Peas + Grapes;
PerTom = (Tomato / Total) * 100;
RUN;
PROC PRINT DATA = homegarden;
TITLE 'Home Gardening Survey';
RUN;

但是如果有缺失值的话,SAS的加法会生成缺失值而不是自动按0处理。为了避免这一点,应该调用sum()函数而不是直接写+。

SAS的函数调用很简单:

AvgScore = MEAN(Scr1, Scr2, Scr3, Scr4, Scr5);
DayEntered = DAY(Date);
Type = UPCASE(Type);

函数有文本类、数字类、日期类等等。

SAS文本类函数

  • ANYALNUM(arg,start):返回第一次出现任意数字或字母的位置,可选开始位置start。
  • ANYALPHA(arg,start):返回第一次出现任意字母的位置,可选开始位置start。
  • ANYDIGIT(arg,start):返回第一次出现任意数字的位置,可选开始位置start。
  • ANYSPACE(arg,start):返回第一次出现任意空白的位置,可选开始位置start。
  • CAT(arg-1,arg-2,...arg-n):连接字符串,留下头尾空白。
  • CATS(arg-1,arg-2,...arg-n):连接字符串,删除头尾空白。
  • CATX('separator-string', arg-1,arg-2,...arg-n):连接字符串,删除头尾空白并用指定标点连接。
  • COMPRESS(arg, 'char'):移除字符串中的空格和可选字符。
  • INDEX(arg, 'string') :返回指定字符在变量中的位置。
  • LEFT(arg) :字符串左对齐。
  • LENGTH(arg):返回字符串长度,不考虑尾部空格。
  • PROPCASE(arg) :首字母大写。
  • SUBSTR(arg,position,n):从字符串中提取指定开始位置指定长度字符。
  • TRANSLATE(source,to-1, from-1,...to-n,from-n):替换字符。
  • TRANWRD(source,from,to) :替换字符串。
  • TRIM(arg):删除尾部空白。
  • UPCASE(arg):替换成大写。

SAS数值函数

  • INT(arg):返回整数。
  • LOG(arg):自然对数。
  • LOG10(arg) :10为底对数。
  • MAX(arg-1,arg-2,...arg-n) :最大值
  • MEAN(arg-1,arg-2,...arg-n) :均值
  • MIN(arg-1,arg-2,...arg-n) :最小值
  • N(arg-1,arg-2,...arg-n) :非缺失值个数
  • NMISS(arg-1,arg-2,...arg-n) :缺失值个数。
  • ROUND(arg, round-off-unit) :保留几位小数。
  • SUM(arg-1,arg-2,...arg-n):求和。

SAS日期函数

  • DATEJUL(julian-date) :标准julian日期到SAS日期。
  • DAY(date):返回「日」。
  • MDY(month,day,year) :年月日到SAS日期。
  • MONTH(date) :返回「月」。
  • QTR(date):返回季度。
  • TODAY():今日
  • WEEKDAY(date):返回周几(周日为1)。
  • YEAR(date):返回「年」。
  • YRDIF(start-date,end- date,’ACTUAL’):返回相差年份。

SAS中判断语句

如果,则:

IF then: IF Model = 'Mustang' THEN Make = 'Ford';

还可以执行多项命令,需要嵌套do;可以用and和or:

IF Year IF Model = 'Corvette' OR Model = 'Camaro' THEN Make = 'Chevy';
IF Model = 'Miata' THEN DO;
Make = 'Mazda';
Seats = 2;
END;

还可以if else:

IF Cost = . THEN CostGroup = 'missing';
ELSE IF Cost ELSE IF Cost ELSE CostGroup = 'high';

用if可以选择数据子集:

IF Sex = 'f'; IF Sex = 'm' THEN DELETE;

SAS中保留和累加

比如要求累加值(等价于R里面的cumsum),需要:

* Using RETAIN and sum statements to find most runs and total runs;
DATA gamestats;
INFILE 'c:\MyRawData\Games.dat';
INPUT Month 1 Day 3-4 Team $ 6-25 Hits 27-28 Runs 30-31;
RETAIN MaxRuns;
MaxRuns = MAX(MaxRuns, Runs);
RunsToDate + Runs;
RUN;
PROC PRINT DATA = gamestats;
TITLE "Season's Record to Date";
RUN;

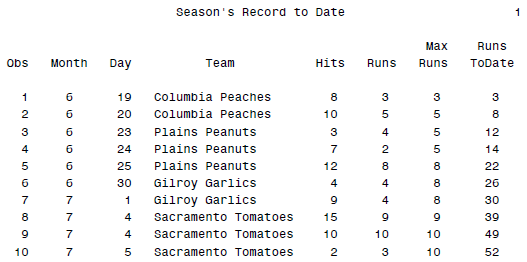
看一眼最终数据:

2013-12-09 16_37_58-The Little SAS Book(Fourth).PDF - Adobe Reader

累加效果出来了~还有一栏是迄今最大值。这也是我觉得sas和R很不同的一点:sas是指针式操作,一行行往下读;而在R里面我们更多是向量或者矩阵式运算,感觉还是有所区别的...

SAS的数组操作

这个就更有点矩阵的味道了,不过还是偶尔感觉怪怪的...感觉数据整理和操纵方面,SAS还是比不上R灵活...

例子为替换为缺失值:

* Change all 9s to missing values;
DATA songs;
INFILE 'c:\MyRawData\WBRK.dat';
INPUT City $ 1-15 Age domk wj hwow simbh kt aomm libm tr filp ttr;
ARRAY song (10) domk wj hwow simbh kt aomm libm tr filp ttr;
DO i = 1 TO 10;
IF song(i) = 9 THEN song(i) = .;
END;
RUN;
PROC PRINT DATA = songs;
TITLE 'WBRK Song Survey';
RUN;

这样9就全部替换为缺失值了。把后面10列认为是一个数组,可以直接操作。

SAS还有若干变量名的快捷方式,暂不赘述了...

Categories
日常应用

七天搞定SAS(一):数据的导入、数据结构

标题有些噱头,不过这里的重点是: speak SAS in 7 days。也就是说,知识是现成的,我这里只是要学会如何讲这门语言,而不是如何边学SAS边学模型。顺便发现我最近喜欢写连载了,自从西藏回来后.....

之所以下定决定学SAS,是因为周围的人都在用SAS。为了和同事的沟通更有效率,还是多学一门语言吧。R再灵活,毕竟还是只有少数人能直接读懂。理论上语言是不应该成为障碍的~就像外语一样,多学一点总是好的,至少出门不发怵是不是?

最后一根稻草则是施老师传给我的一个link:http://blog.softwareadvice.com/articles/bi/3-career-secrets-for-data-scientists-1101712/,据说有数据分析师的职业秘笈...我就忍不住去看了看。其中一句话还是蛮有启发的:

如果有人问你要学什么工具,是SAS,R,EXCEL,SQL,SPSS还是?直接回答:所有。

这个答案一方面霸气,一方面也是,何必被工具束缚呢?

这东西宜突击不宜拖延,所以还是集中搞定吧。七天应该是个不错的时间段。

大致分配如下:
1. 熟悉SAS的数据结构,如基本的向量,数据集,数组;熟悉基本的数据类型,如文本,数字。
2. 熟悉基本的数据输入与输出。
3. 熟悉基本的逻辑语句:循环,判断
4. 熟悉基本的数据操作:筛选行列,筛选或计算变量,合并数据集,计算基本统计量,转置
5. 熟悉基本的文本操作函数
6. 熟悉基本的计量模型函数
7. 熟悉基本的macro编写,局部变量与全局变量

其实这大概也是按照我常用的R里面完成的任务来罗列的。基本计划是完成就可以大致了解SAS的语法了,其他的高级功能现用现学吧。

书籍方面,中文的抢了同事的一本《SAS编程与数据挖掘商业案例》,英文的找了一本「Applied Econometrics Using The SAS System」和「The Little SAS Book」,先这么看着吧。

后知后觉的补充:其实这一系列笔记都是先写再发布的,主要是方便我调整顺序什么的。事实证明绝大多数时间我在看(或者更直接的,抄)「The Little SAS Book」这本书,姚老师的《SAS编程与数据挖掘商业案例》简单看了一晚,作为对于SAS语法的预热。最后那本「Applied Econometrics Using The SAS System」更多是看具体模型的用法了,不是熟悉语法的问题了。例子都是第一本little book上的,很好用。

本系列连载文章:

-------笔记开始-------

SAS的数据类型

2013-12-09 16_41_10-The Little SAS Book(Fourth).PDF - Adobe Reader

首先,sas的编程大概就两块:Data和PROC,这个倒是蛮清晰的划分。然后目前关注data部分。

SAS的数据类型还真的只有两种:数字和文本。那么看来日期就要存成文本型了。变量名称后面加$代表文本型。

SAS的数据读入

手动输入这种就不考虑了,先是怎么从本地文件读入。比如我们有文本文件如下:

Lucky 2.3 1.9 . 3.0
Spot 4.6 2.5 3.1 .5
Tubs 7.1 . . 3.8
Hop 4.5 3.2 1.9 2.6
Noisy 3.8 1.3 1.8 1.5
Winner 5.7 . . .

然后SAS里面就可以用

* Create a SAS data set named toads;
* Read the data file ToadJump.dat using list input;
DATA toads;
INFILE ’c:\MyRawData\ToadJump.dat’;
INPUT ToadName $ Weight Jump1 Jump2 Jump3;
RUN;
* Print the data to make sure the file was read correctly;
PROC PRINT DATA = toads;
TITLE ’SAS Data Set Toads’;
RUN;

这样就建立了一个名为toads的临时数据集,然后读入外部文件ToadJump.dat,然后告诉SAS有四个变量,其中第一个是文本型。这样就OK了。缺失值用一个点.标记。

偶尔数据没那么规范,比如长成:

----+----1----+----2----+----3----+----4
Columbia Peaches 35 67 1 10 2 1
Plains Peanuts 210 2 5 0 2
Gilroy Garlics 151035 12 11 7 6
Sacramento Tomatoes 124 85 15 4 9 1

那么就要有点类似正则表达式的感觉,告诉SAS更多的参数:

* Create a SAS data set named sales;
* Read the data file OnionRing.dat using column input;
DATA sales;
INFILE ’c:\MyRawData\OnionRing.dat’;
INPUT VisitingTeam $ 1-20 ConcessionSales 21-24 BleacherSales 25-28
OurHits 29-31 TheirHits 32-34 OurRuns 35-37 TheirRuns 38-40;
RUN;
* Print the data to make sure the file was read correctly;
PROC PRINT DATA = sales;
TITLE ’SAS Data Set Sales’;
RUN;

这样SAS就可以正确的读数据了—类似于excel的导入文本-固定宽度分隔。

再不规则的话,比如有日期型的:

Alicia Grossman 13 c 10-28-2008 7.8 6.5 7.2 8.0 7.9
Matthew Lee 9 D 10-30-2008 6.5 5.9 6.8 6.0 8.1
Elizabeth Garcia 10 C 10-29-2008 8.9 7.9 8.5 9.0 8.8
Lori Newcombe 6 D 10-30-2008 6.7 5.6 4.9 5.2 6.1
Jose Martinez 7 d 10-31-2008 8.9 9.510.0 9.7 9.0
Brian Williams 11 C 10-29-2008 7.8 8.4 8.5 7.9 8.0

那么接下来就是:

* Create a SAS data set named contest;
* Read the file Pumpkin.dat using formatted input;
DATA contest;
INFILE ’c:\MyRawData\Pumpkin.dat’;
INPUT Name $16. Age 3. +1 Type $1. +1 Date MMDDYY10.
(Score1 Score2 Score3 Score4 Score5) (4.1);
RUN;
* Print the data set to make sure the file was read correctly;
PROC PRINT DATA = contest;
TITLE ’Pumpkin Carving Contest’;
RUN;

就是说,name是一个长度为16的字符;age是长度为3、无小数点的数字;+1跳过空列;type是长度为1的文本;date是MMDDYY长度为10的日期;score1-5是长度为4,小数部分为1位的数字。

还有若干更复杂的,可以遇到时侯回来查手册。此外还有@可用来直接指定开始读的列。鉴于我接触的数据一般比较规范,这些就不细看了。

此外SAS可以指定开始读的行数,读取的行数等。

DATA icecream;
INFILE ’c:\MyRawData\IceCreamSales.dat’ FIRSTOBS = 3;
INPUT Flavor $ 1-9 Location BoxesSold;
RUN;

SAS读取CSV数据

以我最关心的CSV文件为例,如下数据:

Lupine Lights,12/3/2007,45,63,70,
Awesome Octaves,12/15/2007,17,28,44,12
"Stop, Drop, and Rock-N-Roll",1/5/2008,34,62,77,91
The Silveyville Jazz Quartet,1/18/2008,38,30,42,43
Catalina Converts,1/31/2008,56,,65,34

只需要:

DATA music;
INFILE ’c:\MyRawData\Bands.csv’ DLM = ’,’ DSD MISSOVER;
INPUT BandName :$30. GigDate :MMDDYY10. EightPM NinePM TenPM ElevenPM;
RUN;
PROC PRINT DATA = music;
TITLE ’Customers at Each Gig’;
RUN;

其实,貌似更简单的办法是:

DATA music;
INFILE ’c:\MyRawData\Bands.csv’ DLM = ’,’ DSD MISSOVER;
INPUT BandName :$30. GigDate :MMDDYY10. EightPM NinePM TenPM ElevenPM;
RUN;
PROC PRINT DATA = music;
TITLE ’Customers at Each Gig’;
RUN;

好吧,import果然更直接一点...excel文件也可以如法炮制。

SAS读取excel数据

* Read an Excel spreadsheet using PROC IMPORT;
PROC IMPORT DATAFILE = 'c:\MyExcelFiles\OnionRing.xls' DBMS=XLS OUT = sales;
RUN;
PROC PRINT DATA = sales;
TITLE 'SAS Data Set Read From Excel File';
RUN;

如果需要SAS永久存着这些数据,则需要先指定libname:

LIBNAME plants ’c:\MySASLib’;
DATA plants.magnolia;
INFILE ’c:\MyRawData\Mag.dat’;
INPUT ScientificName $ 1-14 CommonName $ 16-32 MaximumHeight
AgeBloom Type $ Color $;
RUN;

后期就可以直接调用啦:

LIBNAME example ’c:\MySASLib’;
PROC PRINT DATA = example.magnolia;
TITLE ’Magnolias’;
RUN;

SAS 读取Teradata数据

最后就是从teradata里面读数据,可以利用teradata fastexport特性:

libname tra Teradata user=terauser pw=XXXXXX server=boom;
proc freq data=tra.big(dbsliceparm=all);
table x1-x3;
run;

等价于:

proc sql;
connect to teradata(user=terauser password=XXXXXX server=boom dbsliceparm=all);
select * from connection to teradata
(select * from big);
quit;

暂时没有fastload的需求,就先这样吧。可以参见SAS的TD手册:http://support.sas.com/resources/papers/teradata.pdf

本系列连载文章:


Categories
网络新发现

Coursera上的R语言课程

今天登上Coursera一看,随便点开几门课居然都是用R来辅助的...R是什么时候悄悄的渗透到这么多大学和行业的哇?孤陋寡闻了呢。

入门的,如专门的数据分析计算,有一门Computing for Data Analysis,是时长为4节的R语言课程。讲的貌似比较基础:

This course is about learning the fundamental computing skills necessary for effective data analysis. You will learn to program in R and to use R for reading data, writing functions, making informative graphs, and applying modern statistical methods.

还有一门类似的,Data Analysis(居然是Johns Hopkins的生物统计研究生院一年级的课程):

This course will focus on how to plan, carry out, and communicate analyses of real data sets. While we will cover the basics of how to use R to implement these analyses, the course will not cover specific programming skills. Computing for Data Analysis will cover some statistical programming topics that will be useful for this class, but it is not a prerequisite for the course.

当然,基础的统计课程也是R的天下了:Statistics One

Statistics One also provides an introduction to the R programming language. All the examples and assignments will involve writing code in R and interpreting R output. R software is free! It is also an open source programming language. What this means is you can download R, take this course, and start programming in R after just a few lectures.

经济与计量、金融计算自然也不能免俗...Introduction to Computational Finance and Financial Econometrics

Learn mathematical and statistical tools and techniques used in quantitative and computational finance. Use the open source R statistical programming language to analyze financial data, estimate statistical models, and construct optimized portfolios.

自然还有类似的金融课程:Financial Engineering and Risk Management

With regards to programming, we have designed the course so that all required "programming" questions can be completed within Excel. However some questions may be easier to complete using Matlab, R, Python etc.

然后居然还看到社会网络分析也是用R来辅助的:Social Network Analysis,这里有我最喜欢的Gephi和R,咿呀呀,不奇怪的嘛,好歹我也是研究了SNA那么久了呢。

We will be using Gephi for visualization and analysis. The interactive demonstrations will be primarily in NetLogo, which you will be able to access through your web browser. If you would like to complete the programming assignments, which will be done in NetLogo and R, NetLogo is freely available here and R is freely available here.

显然这远远没有结束...生统方面,Mathematical Biostatistics Boot Camp自然也是用R的:

临床上也是...Data Management for Clinical Research

  • What resources will I need for this class?
    For this course, you will need: 1) an Internet connection; 2) software package capable of generating table-based CSV files (e.g. Microsoft Excel, Google Docs, Numbers); and 3) and an install of the open-source R programming platform.

好吧,我已经不奇怪会看到更多的了。这两年业界对于R的需求井喷,绝对跟学校里面的教育脱不开干系。不过如果我只是一味列举而不是比较,那岂不是有违统计学风范?R跟C或者Java比显然没有意思...不是做一件事儿的嘛。SAS的结果只有一门,Passion Driven Statistics,我猜很大程度上是这东西不免费,不能让每个学生都有的用;Matlab就多很多了,主要是Matlab的计算确实强大,其他的跟它确实没法比啊(至今我写模拟还是喜欢在Matlab里面写矩阵运算...R里面涉及到无路可逃的循环真的是让人忍无可忍),目测有9门课程使用。注:Stata结果为0,哎,真的是打不过免费软件啊。

赘述完毕...


Categories
事儿关经济

数据库规范与SQL应用[3rd week, July]

以前也说过,这个暑假过得相当的“充实”,每天白天8节课(其实我也是三天打渔,两天晒网),晚上回到家练习练习做饭,然后就打开本本开始忙碌的工作。一边看无尽paper,一边绞尽脑汁的搜数据,遇到问题开始到处请教,日子倒也颇为充实。

记得春天的时候写那篇关于FDI的破文章的时候狠狠的感慨了一番国内统计年鉴质量之差,大部分时间都耗在搜集数据上(尤其是把某些图片格式的数据手动输入到数据库里)了,实在是让人哭笑不得。这次写论文用到一些微观数据,其中一部分是鼎鼎大名的中国营养健康调查(China Health and Nutrition Survey,简写CHNS),虽然下载下来的都是SAS格式,但是借助stat transfer还是很容易就转到stata格式了(我算是被“威逼”+“利诱”彻底背叛SPSS了)。然后接下来,我就无语了,开始面对如山的变量……把问卷下下来,又把变量说明下下来,一个个对照着理解……好痛苦啊。

然后需要筛选变量了。按照欣欣姐屡次的提醒,乖乖的开始写do file。其实我还是习惯直接在命令行里面输入……

郁闷的就是对Stata的命令实在是太陌生了,不得不一次次的help。drop...keep...merge...一个个看下来,花了不少时间。开始残念那个叫做SQL的东西,开始回忆当时老老实实学习数据库的日子……怎么也是标准的计算机学院教材训练出来的,还是对于SQL最熟悉,虽然时日已久开始淡忘……

网上搜了搜,好像SAS支持SQL但是Stata并不支持SQL查询和操作,唉。虽然stata各种简单的函数简化了许多操作,但是至少应该保留一个sql接口供习惯sql的人来使用嘛。SQL多好啊,简单的语句组合就那么万能无敌……标准的数据库操作语言啊~

其实stata终归还是一个统计分析软件,并不是数据库管理软件,也就是说它的任务是“分析”而不是“管理”数据。但是我实在是不知道怎么把数据整理好再交给stata分析,只能在stata里面整理了。实在是为难stata,也为难我了。呜呼!

我想,当初要是考虑留下一个sql窗口,会方便许多吧。不知道是为了简化操作还是什么的,非要单独出来一些函数。唉。

也没什么好办法了,相比于借助其他DMS(Data Management System,数据管理系统)整理好再转到stata格式,我还是直接在stata里面操作好了。或许后者效率还是稍稍高些吧,毕竟原理都一样。只是期待,某些约定俗成的标准和规范,应该更为广泛的传承和延续,节省大家的时间,专注于研究而不是无谓的浪费在过程之中。

无论如何,我还是希望尽快的弄完数据这块,专心于经济分析中。